3D localization using defect-induced waves
The goal of this research is to minimize the number of receivers needed for defect localization in hazardous environments, where robotic deployment is crucial to eliminate human exposure. Focusing on hollow cylindrical structures, we have developed a waveform-based method that exploits the unique patterns created by the cylindrical geometry. [article]
Impact
Receiver Efficiency
Our method reduces the required receivers from 4 to 2, ensuring precise defect localization while simplifying robotic deployment logistics.
Enhanced 3D Localization
By leveraging the entire waveform, our approach achieves 3D defect positioning, surpassing traditional 2D methods and empowering more informed maintenance decisions.
Propagation Pattern
The formation of defects induces elastic waves to propagate through the structure. In plate-like structures—such as a hollow cylinder, which can be thought of as a wrapped-up plate, the boundary conditions give rise to a special wave mode called guided wave. Unlike traditional ultrasonic waves that bounce within a medium (like in medical ultrasound exams), guided waves carry energy along the boundary of the medium.
These waves propagate from the source in circular-crested wave fronts, similar to the ripples created when a stone is dropped into a lake. In most cases, we observe the fundamental symmetric mode (S0) and the fundamental asymmetric mode (A0), with S0 traveling faster than A0.
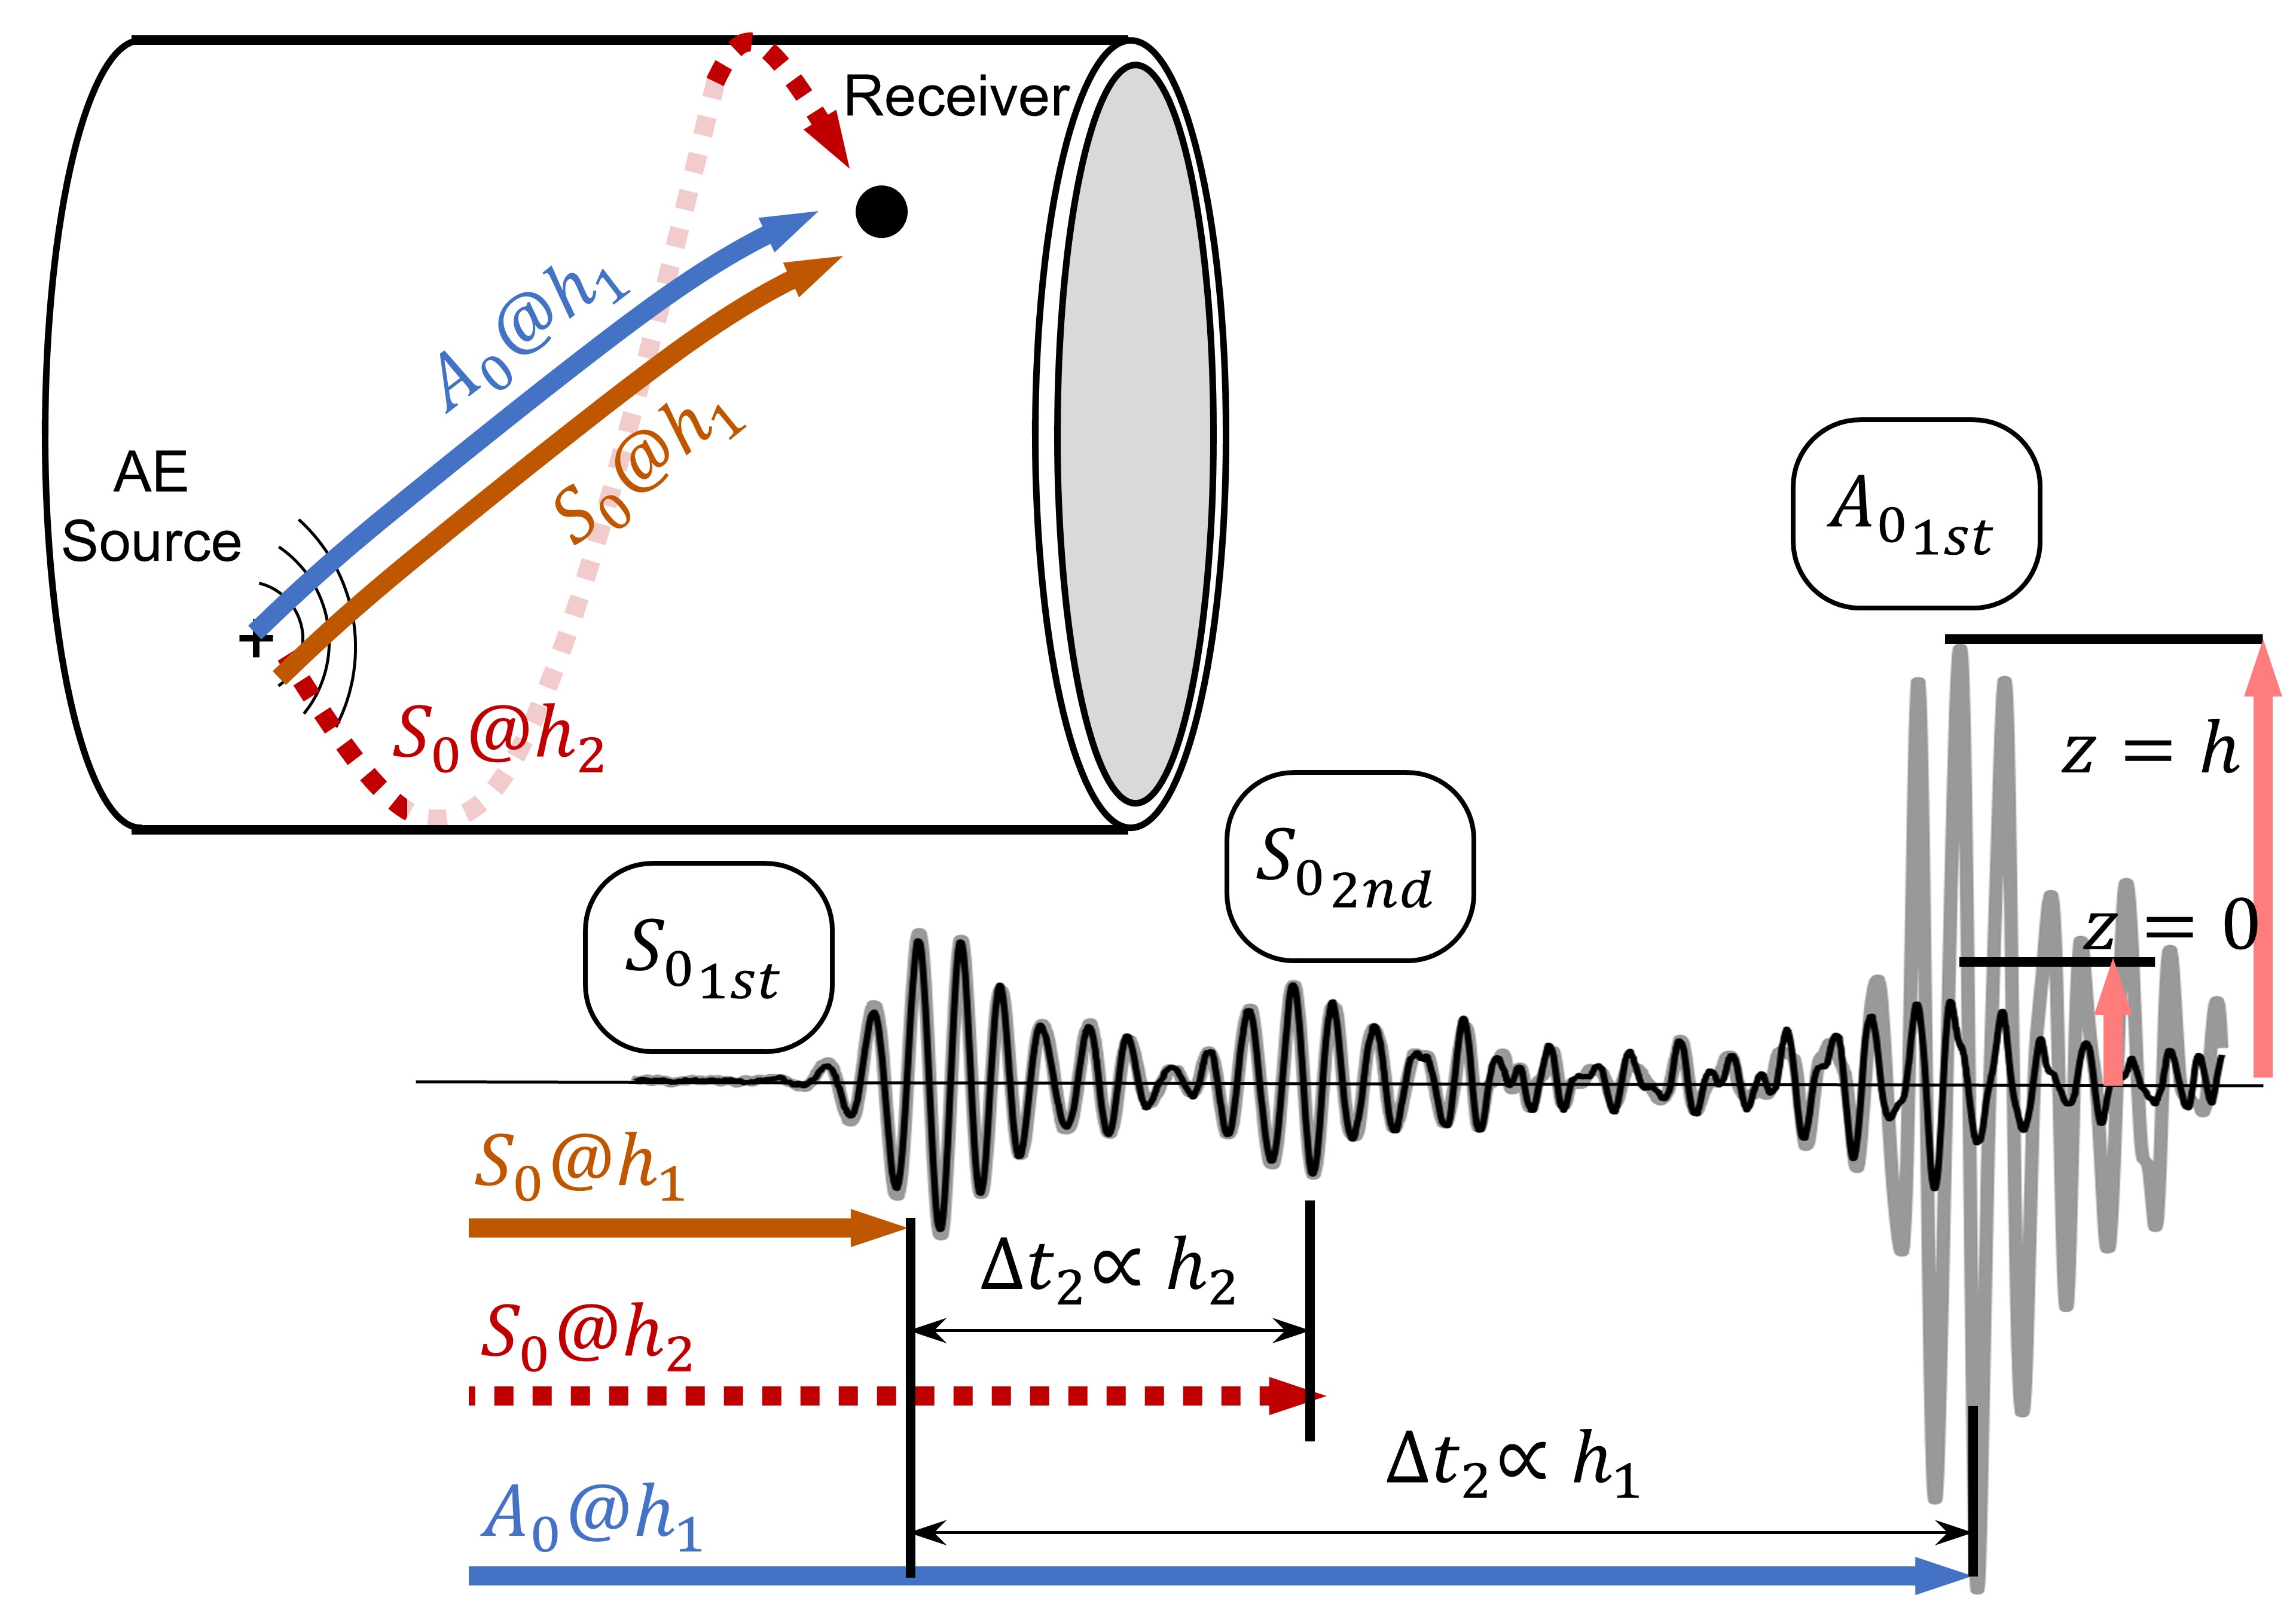
And here’s the cool part: in a hollow cylinder, the “plate” has no boundary, meaning there are infinite possible paths between two points. For example, the direct path and 2nd-order paths are shown in the figure below. More interestingly, the lengths of these paths are unique to the source’s coordinates!
As a result, energy arrives at a receiver with time delays corresponding to the unique combination of path lengths, making the waveform distinctive for each source location. The figure below illustrates how path lengths and mode arrivals contribute to the waveform’s uniqueness relative to the source coordinates.
Variational AutoEncoder Modeling
This research leverages a Variational AutoEncoder (VAE) model to capture the above patterns in an unsuperivsed manner. This data-driven Bayesian framework identifies patterns in waveforms and reduces high-dimensional data into a compact latent space. The model operates on waveform envelopes, capturing unique dispersion characteristics that correlate with source locations. By predicting spatial coordinates and quantifying uncertainties in experimental data, the VAE model enhances both the accuracy and reliability of localization, providing valuable insights for monitoring critical infrastructure.
Bayesian Approach and Latent Variable Utility
The Bayesian foundation of the VAE model is critical for addressing the uncertainties inherent in experimental data. Variations in waveforms, often caused by noise or external factors, are captured within the probabilistic framework, ensuring robust predictions even in challenging conditions.
Within this latent space, the latent variables serve a dual purpose:
- Encoding Localization: They encode the localization process while capturing and propagating the uncertainties inherent in experimental data. This allows the model to predict spatial coordinates and provide a measure of the variability or uncertainty associated with those predictions.
- Interpreting Waveform Characteristics: The latent variables reflect the influence of source coordinates on waveform characteristics. By reconstructing waveforms from the latent space, the model demonstrates how changes in source location are embedded in and affect the waveform structure.
This dual role highlights the latent variables as both a representation of localization and a means to approximate and interpret the uncertainties in the data.
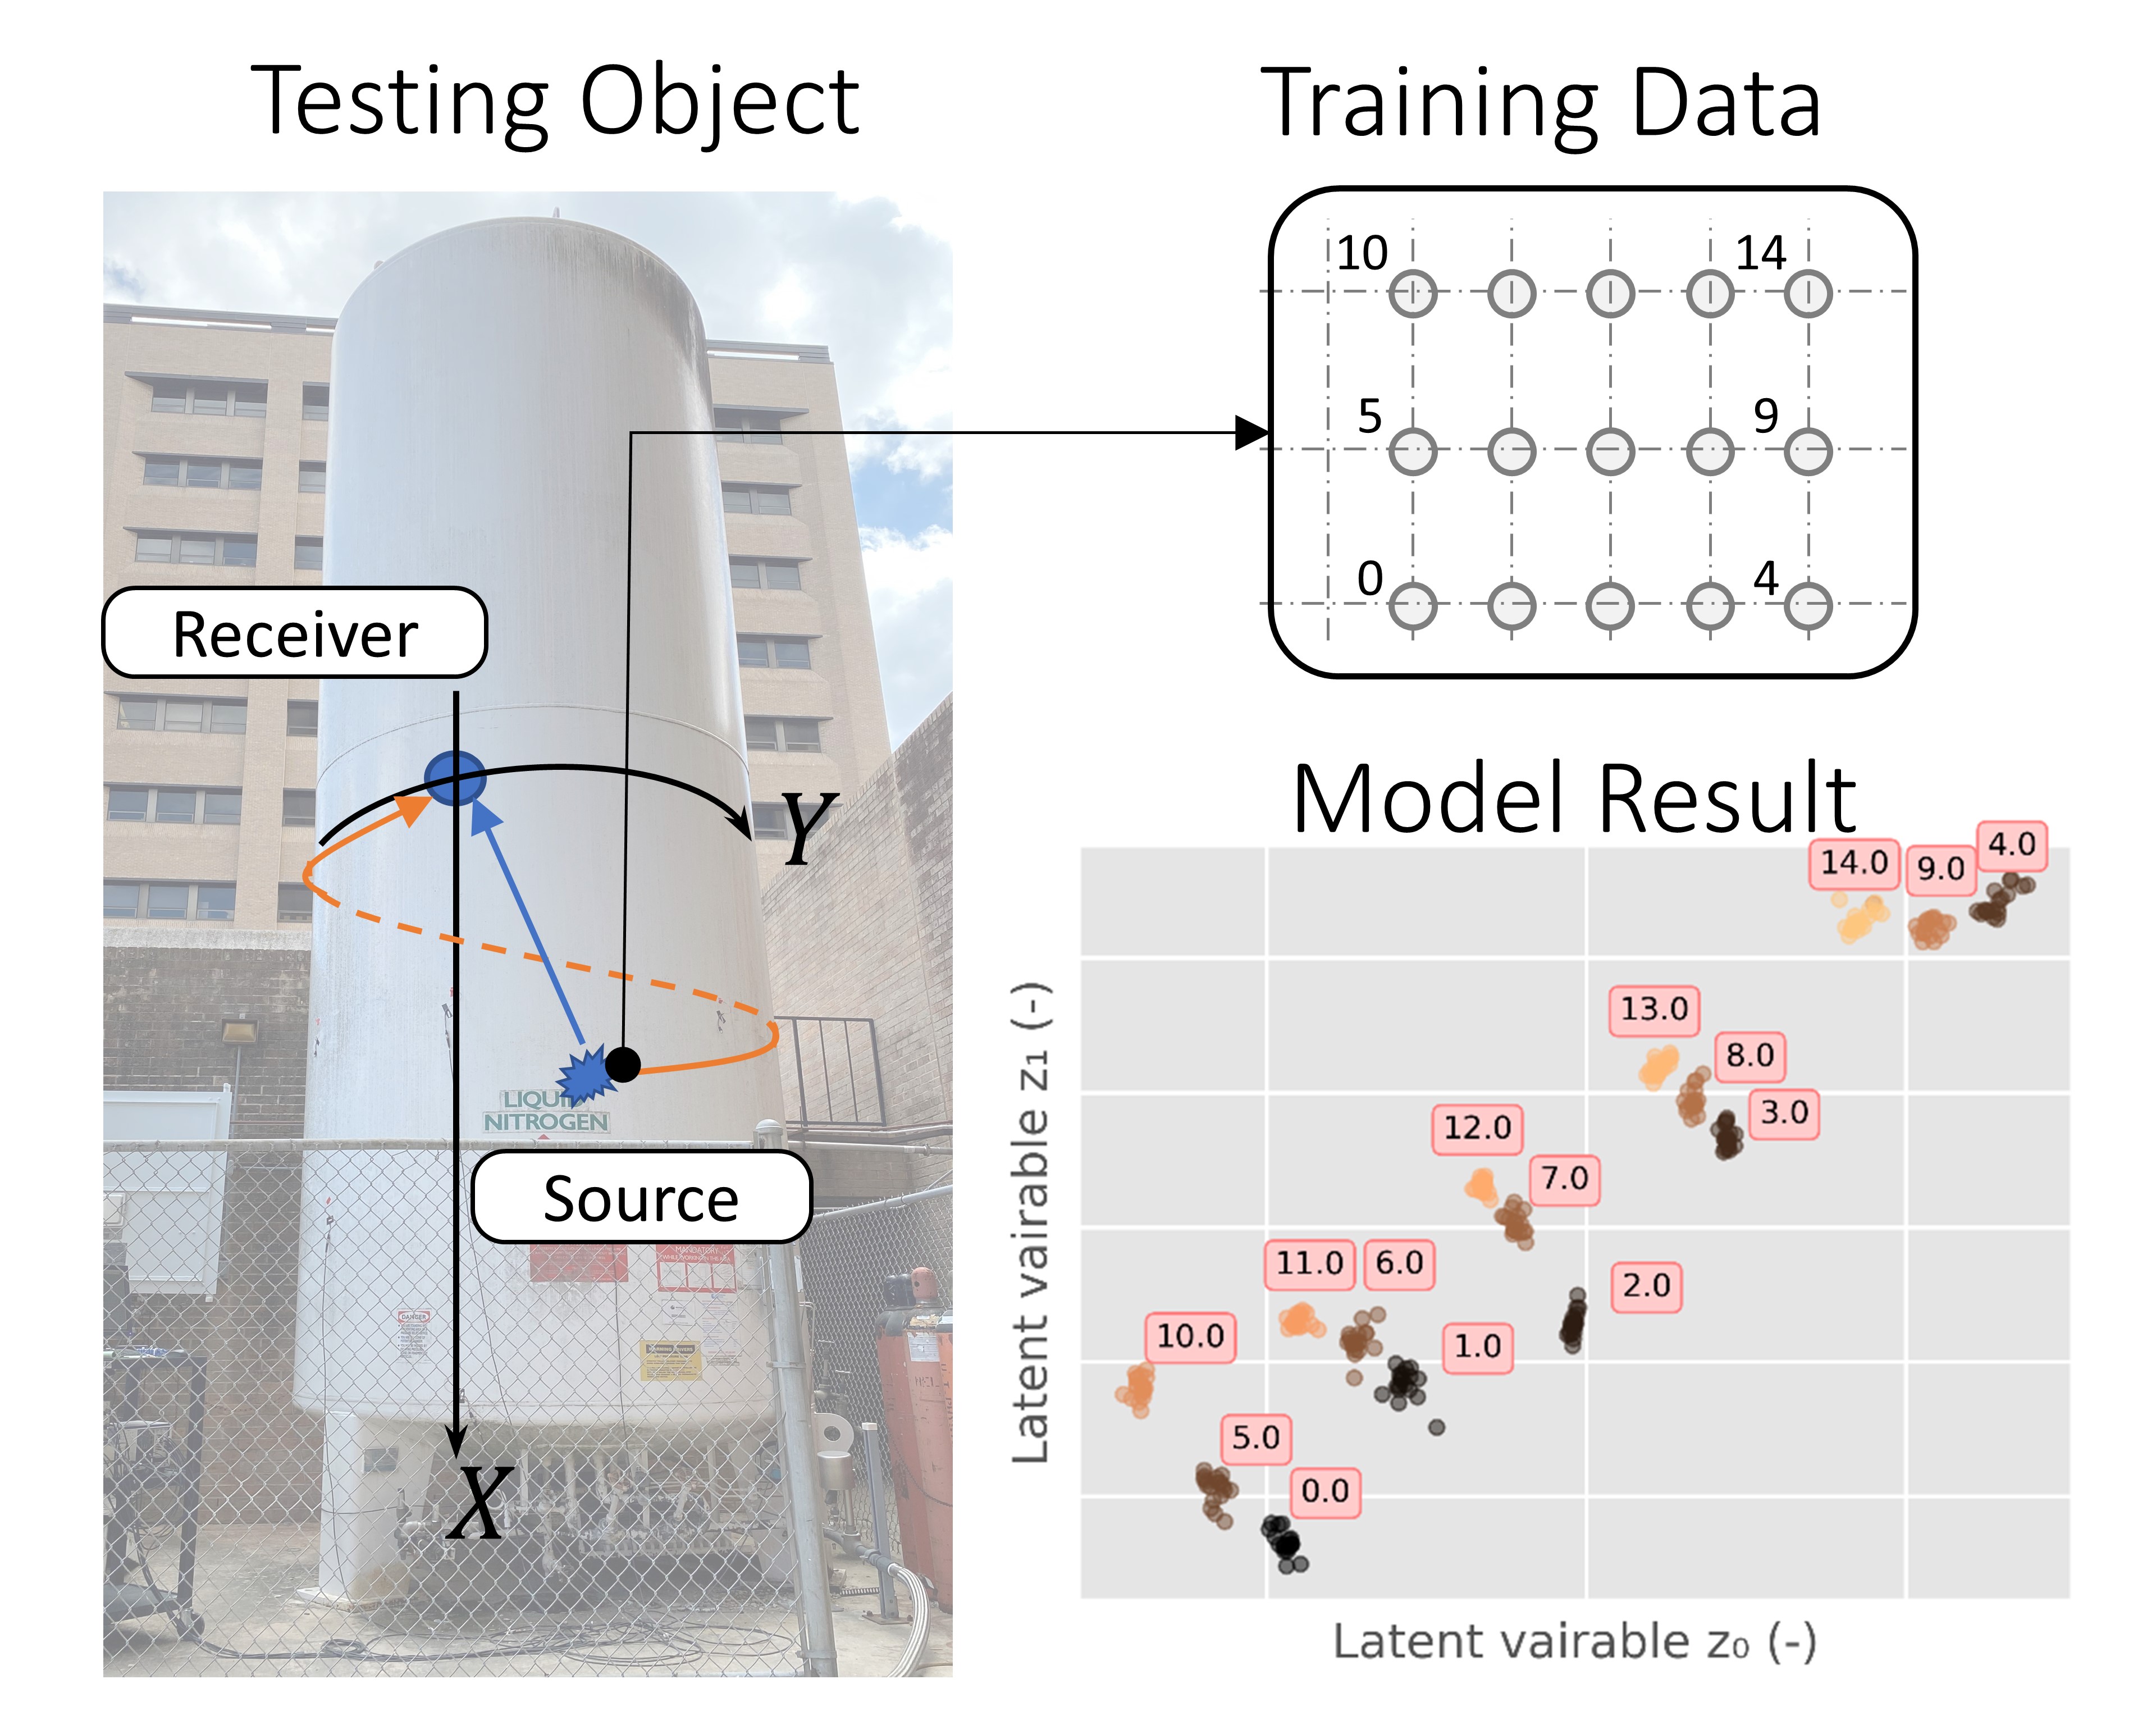
A validation of the model using a dataset collected from a 2-story-tall gas cylinder is presented below. The latent space effectively separates the data by source coordinates.
The 3D results are documented in a journal paper, and an interactive 3D latent space visualization can be explored here.